Dipanjan Maity

Data Analyst

My Resume

Know more

About Me

I am a flexible, quick-to-learn person who is looking to contribute excellent analytical ability, operational expertise, and data organization skills for the benefit of an organization and its customers. I am effective in deriving insights from unstructured data by leveraging SQL, Python, Excel and Tableau, for any amount of data. I strive in collaborative environments to achieve the effective management of quantitatively complex data.

Education

Masai School

Course on Data Analyst

Training curriculum include Excel, SQL, Tableau, Python, with emphasis on real-life problem solving techniques using Case s. Also trained in guesstimate techniques, Machine Learning covering the basis from Linear algebra and Probability & Statistics.

National Institute of Technology, Durgapur

M.Tech in Operations Research

Final Year Thesis: APPLICATION OF MARKOV CHAIN IN CREDIT RISK MANAGEMENT.

Curriculum included: Optimization Techniques, Soft Computing, Probability & Statistics, Decision Making and Graph Theory.

University of Calcutta

B.Tech in Fibre Technology

Final Year Project: Study on The Tensile Behavior of Fabrics

Certifications

IBM Data Science

Certified on: 19th July 2022

Certified by Coursera

IBM Data Analyst

Certified on: 13th August 2022

Certified by Coursera

Projects

Stack Overflow Developer Survey

  • Gathered data in a variety of formats, like .csv, .xlsx, and databases, by scraping websites and utilizing APIs.
  • Used Data wrangling techniques to pre-process the data.
  • Performed statistical analysis for data examination.
  • Built dashboard by the aid of IBM Cognos Analytics to combine all the data.
Tech Stack: SQL, python libraries like pandas and seaborn, and IBM Cognos Analytics

View Project

Expoloratory Data Analysis on Hotel Booking Dataset

  • Analyzed the data in order to identify significant elements that influence hotel reservations using different libraries like Pandas, Matplotlib, and Seaborn.
  • Performed Univariate, Bivariate & Multivariate analysis.
  • Made a PowerPoint presentation to display all the insightful information.
Tech Stack: Python and Microsoft PowerPoint

View Project
View More Projects

Host Behaviour Analysis

  • Analyzed the Property Rental Dataset of two Canadian cities Toronto and VANCOUVER using SQL (Structured Query Language).
  • Compared hosts based on several criteria such as acceptance rate, response rate, instant booking, profile picture, identity verification, etc.
  • Discovered insights about hosts by creating different charts using Excel.
Tech stack: Microsoft SQL Server, Microsoft Excel, Microsoft Powerpoint

View Project

E-commerce Sales Dashboard

  • Examined the various sales figures for the E-commerce company using a variety of Excel functions.
  • Examined the various sales figures for the E-commerce company using a variety of Excel functions.
  • Built an Interactive Dynamic Dashboard and showcased Key Performance Indicators using Pivot Features, tables, different graphs & slicers.
Using: Microsoft Excel

View Project

AirBnB Dashboard

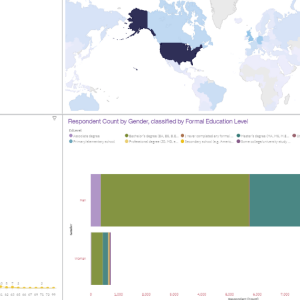
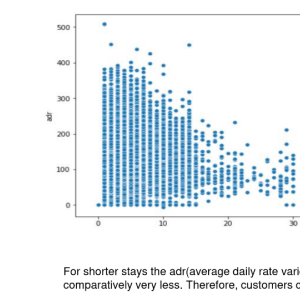
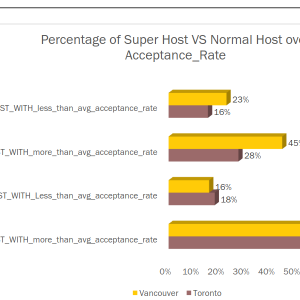
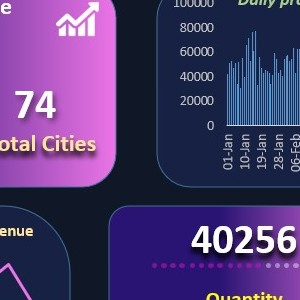
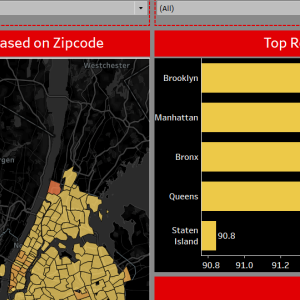
Data Scraping from AirBnB, followed by Analysis and then presenting it in a dashboard.

Using: Tableau
View Project

Skills